

Appendix
Learn about the 2026 State of Credentialing methodology and learner and credential issuer survey demographics.

The 2026 State of Credentialing is based on two original online surveys fielded in spring 2026 by Mantis Research in partnership with Accredible.
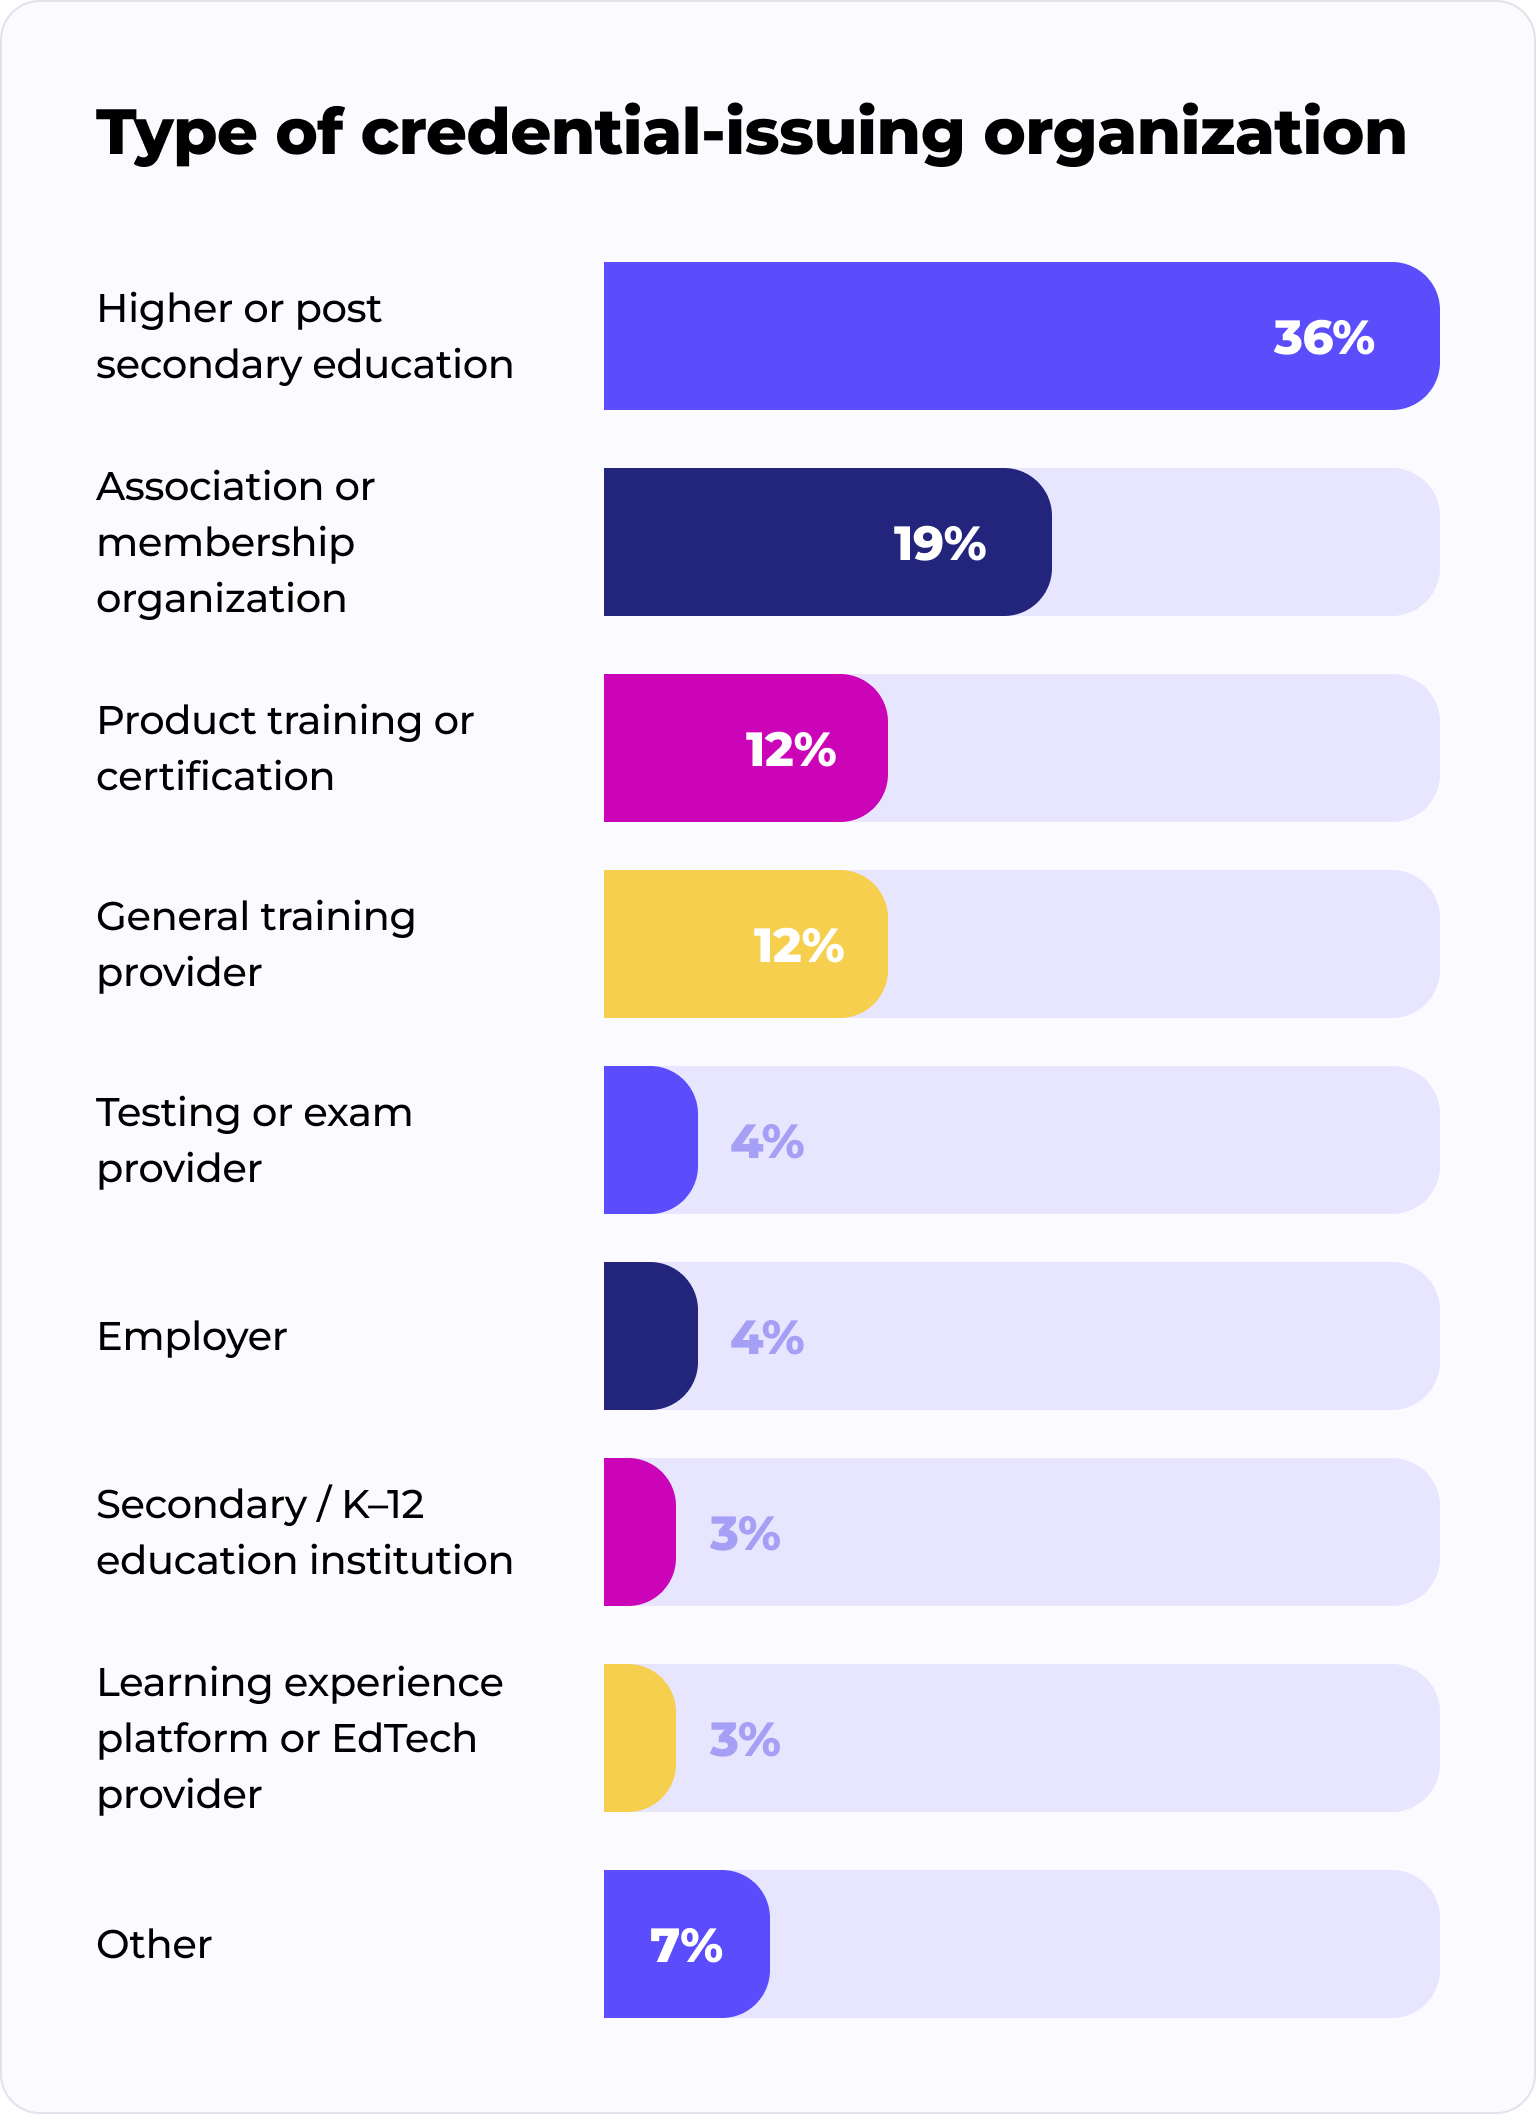
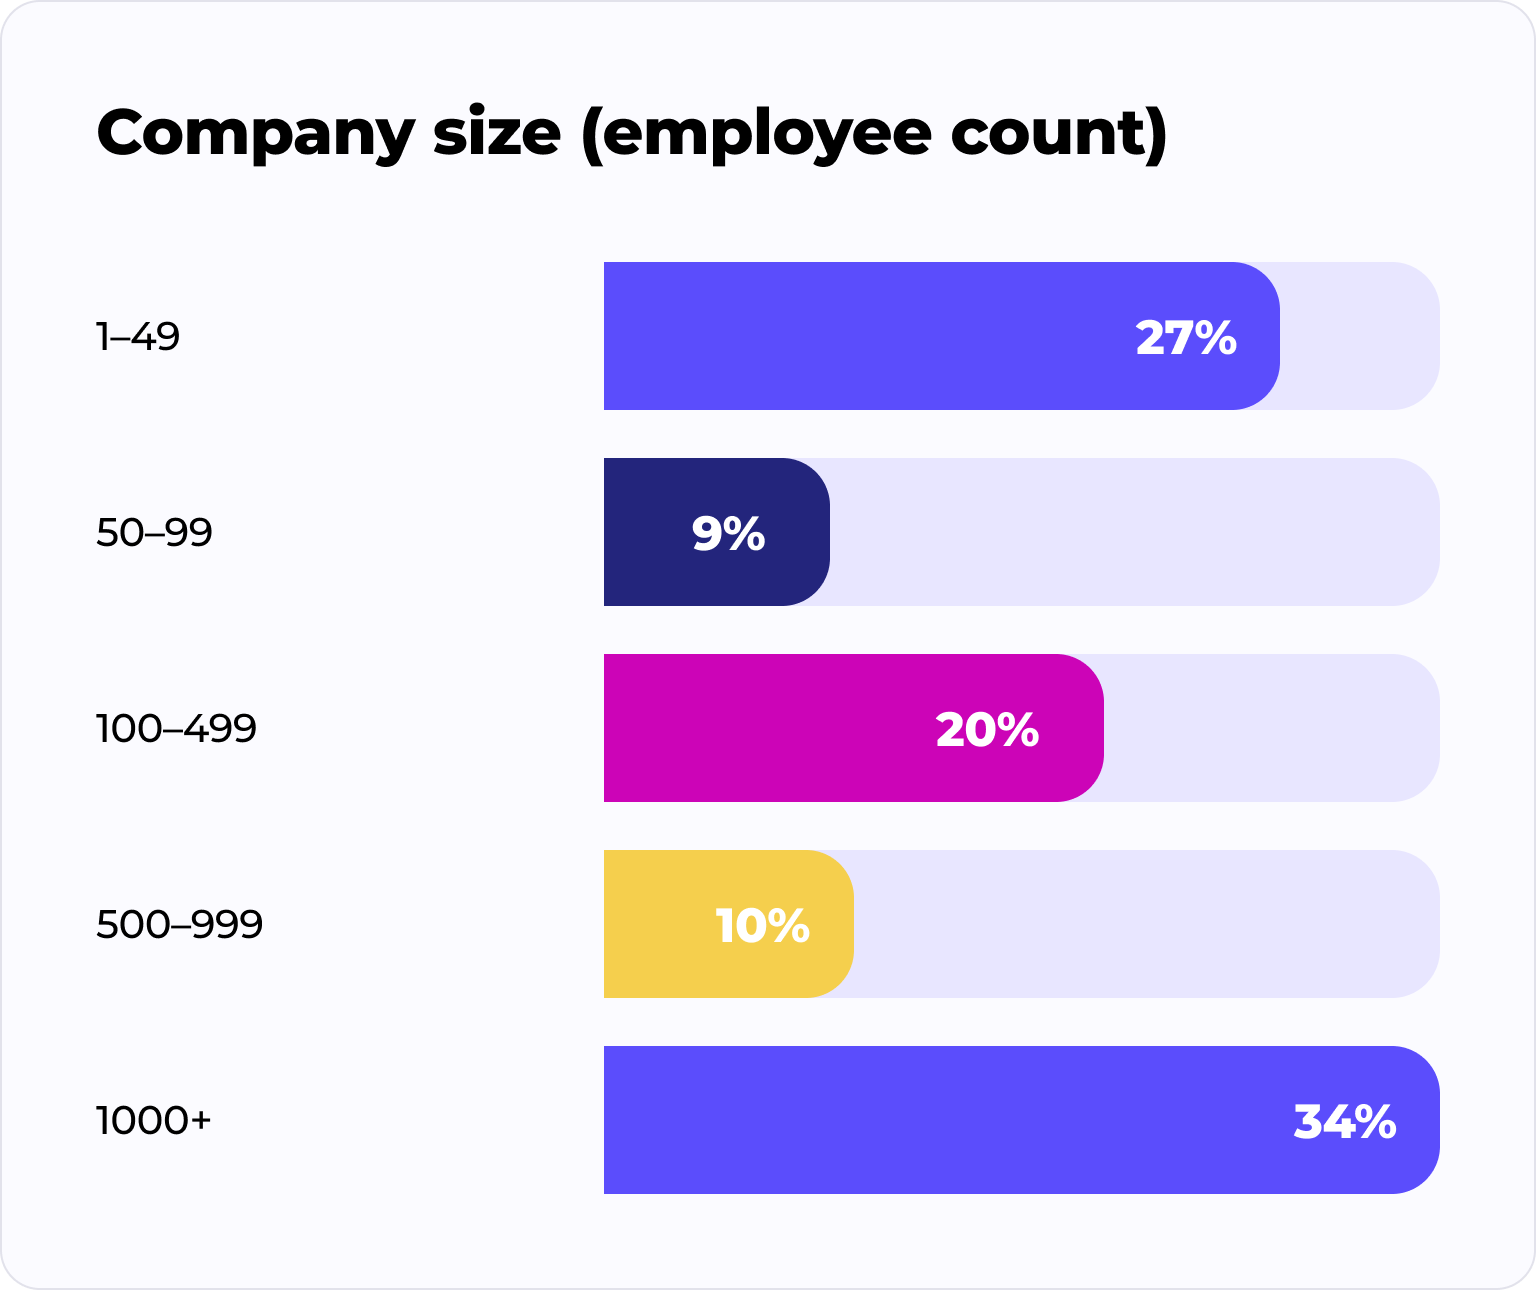
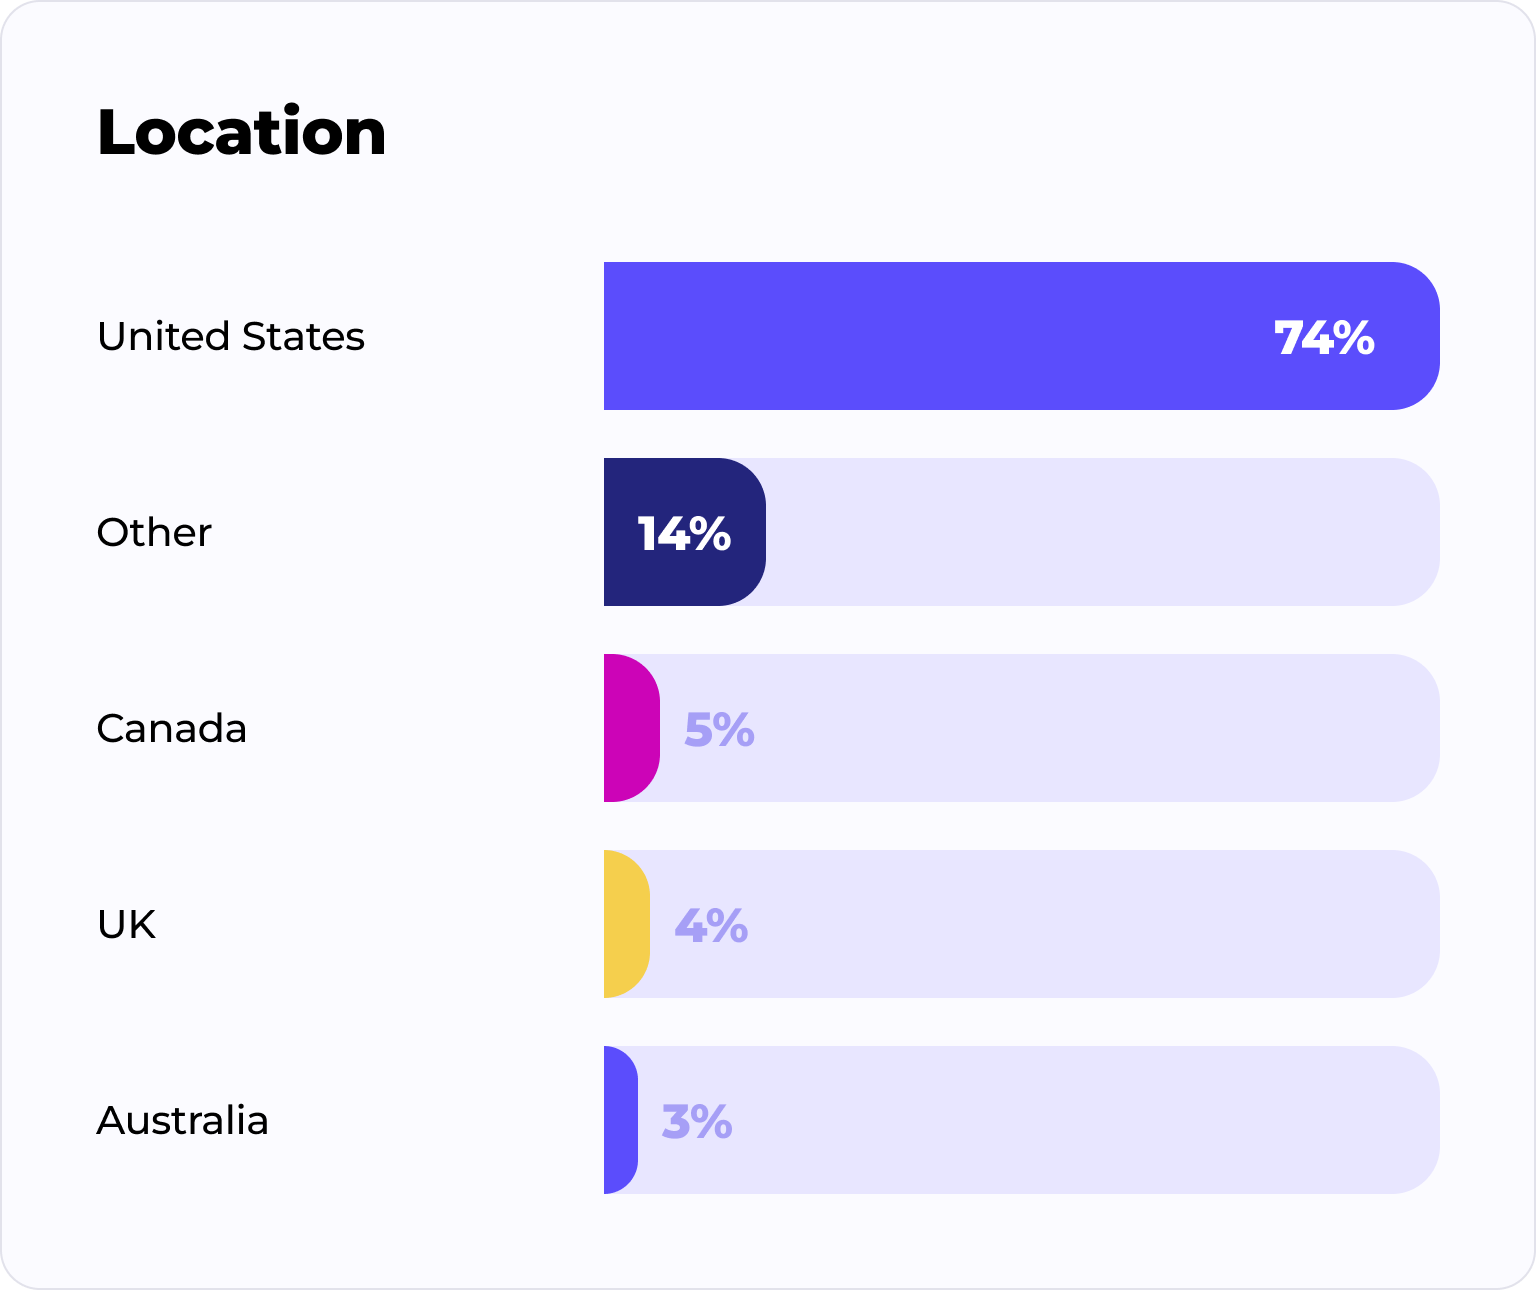
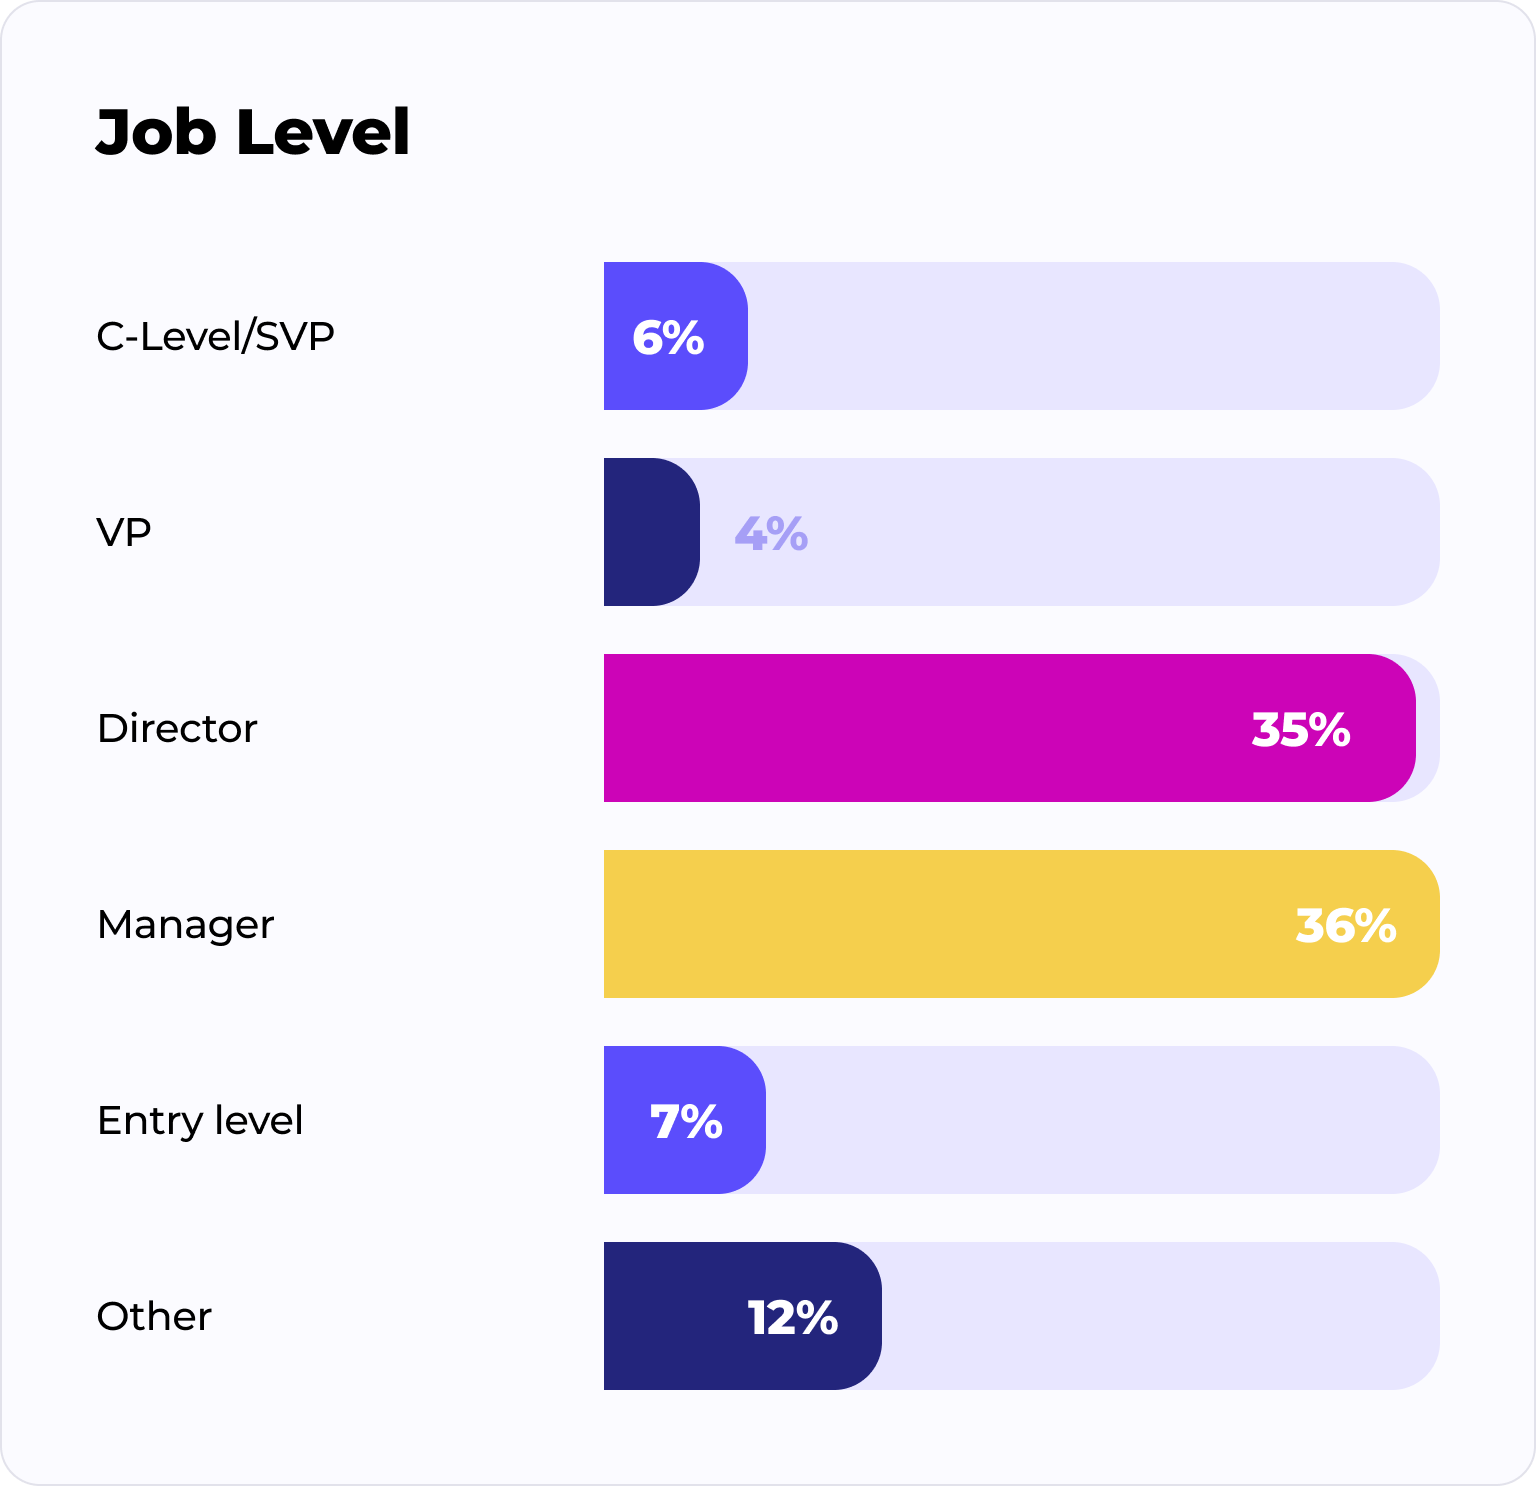
- Credential issuers (n=194): Education and training leaders at organizations that issue digital certificates and/or badges as part of learning or certification programs. Recruited via Accredible and 1EdTech.
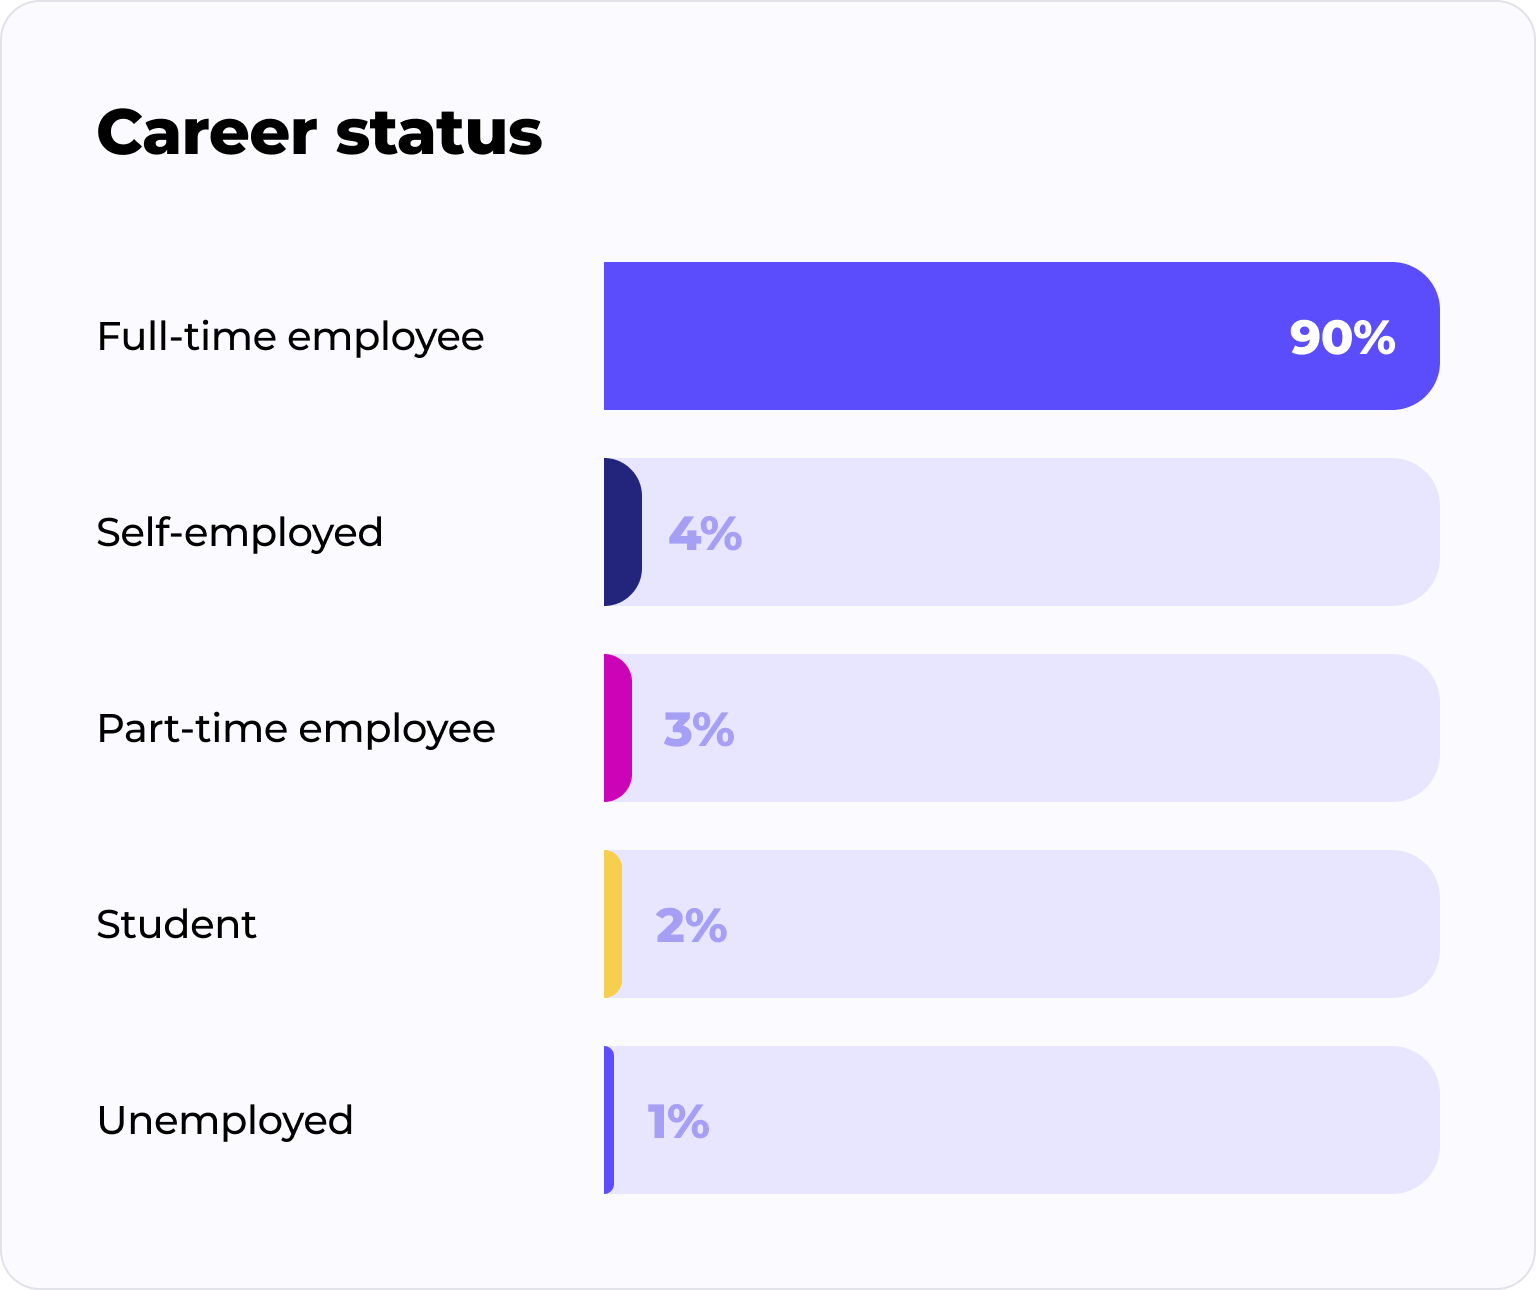
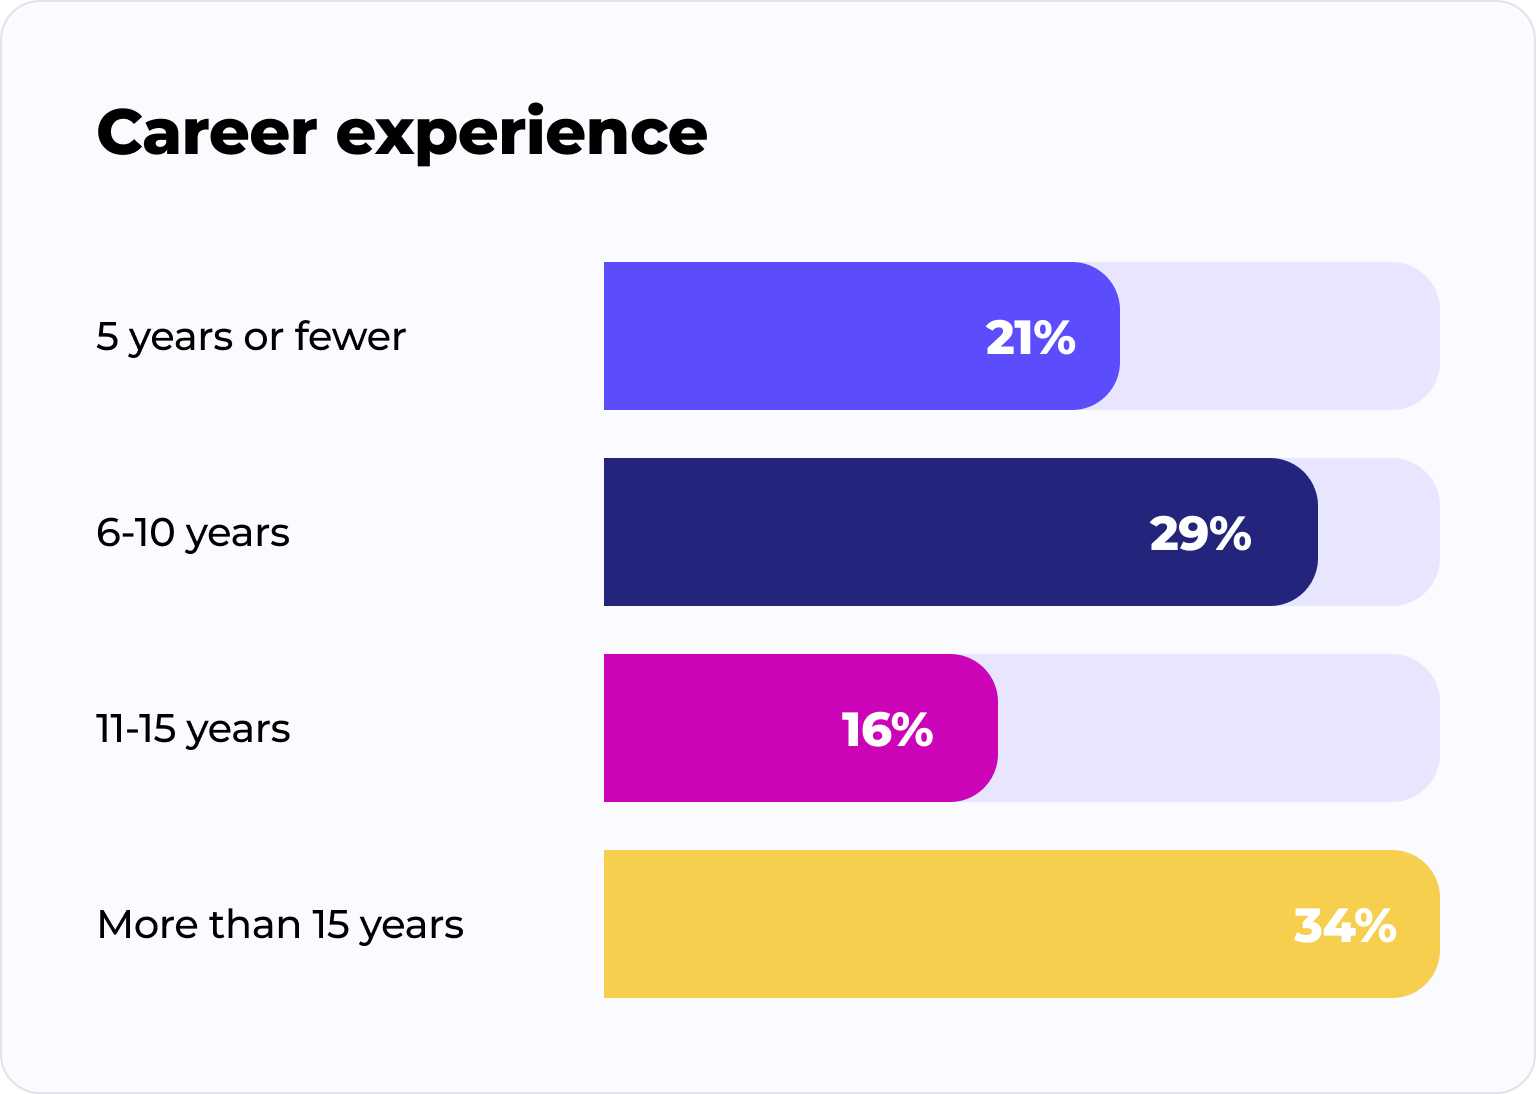
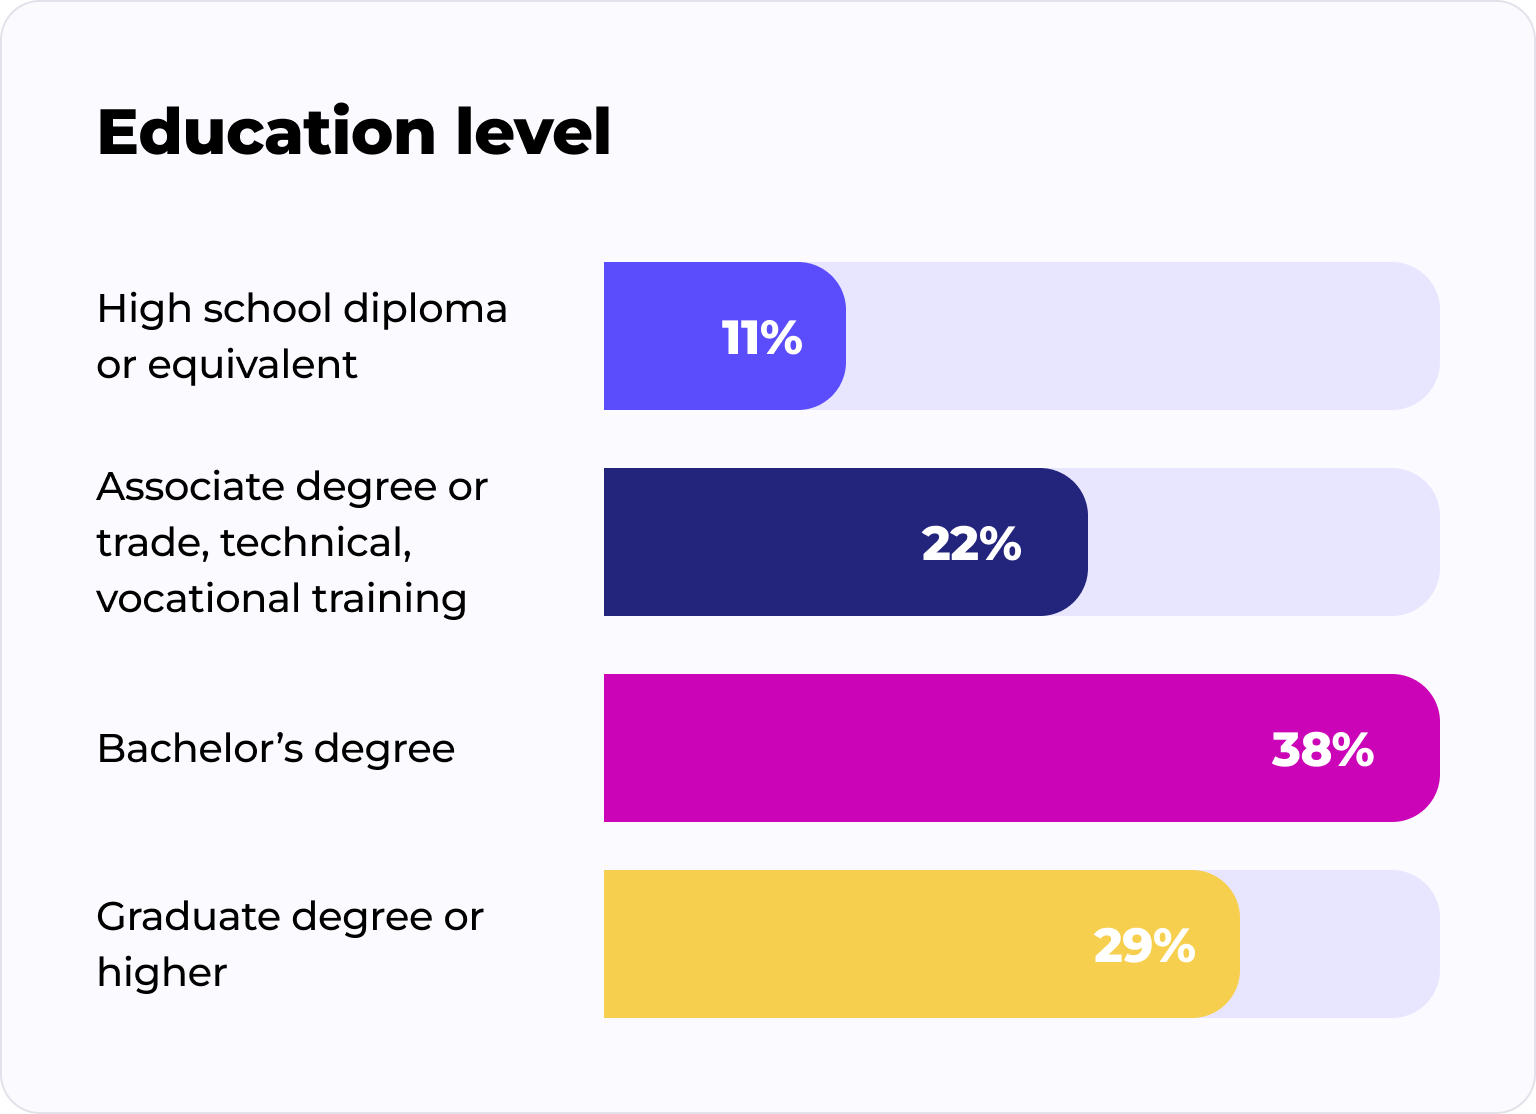
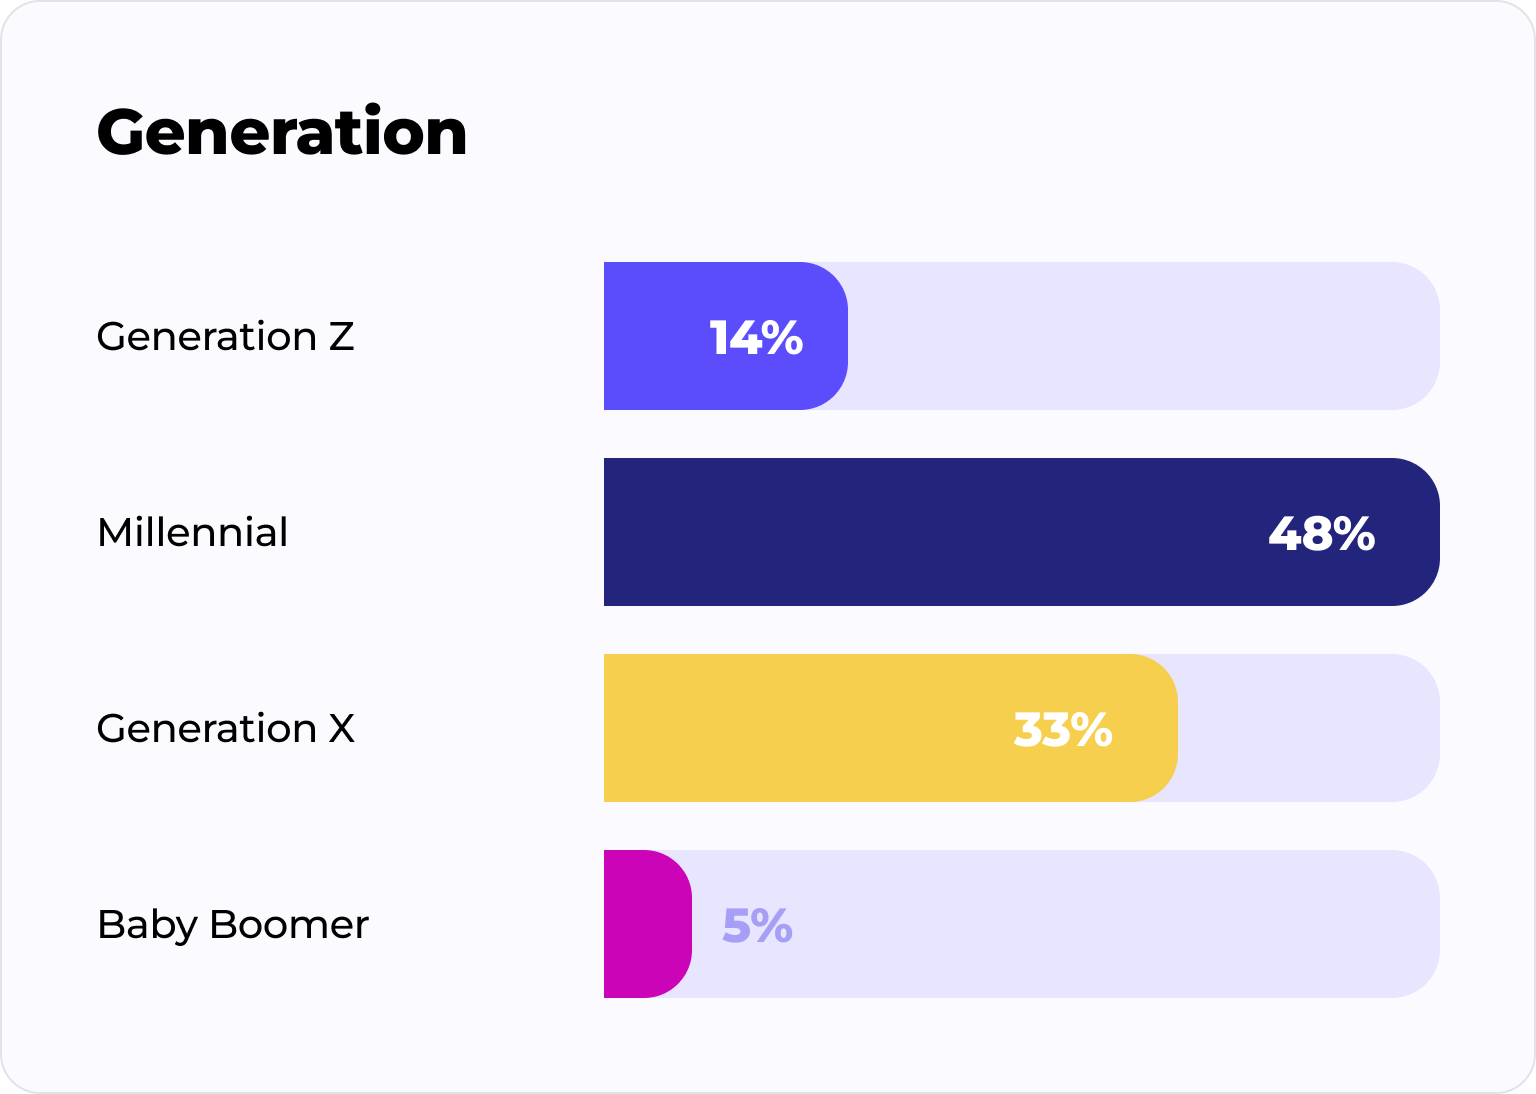
- Learners (n=1000): People in the United States who participated in a course, certification program, or continuing education opportunity that awarded a credential within the past two years. The course needed to be taken to learn new skills to launch and/or help them with their career.
Key definitions
- Digital credentials: Verifiable digital certificates and/or badges issued for learning or achieving certification requirements.
Data notes
- Some questions included an “I’m not sure” option. Unless otherwise specified, these responses were excluded, and percentages recalculated.
- “Other (please specify)” write‑ins were excluded from visuals unless a clearly repeated theme warranted separate categorization or mention.
Credential issuers surveyed
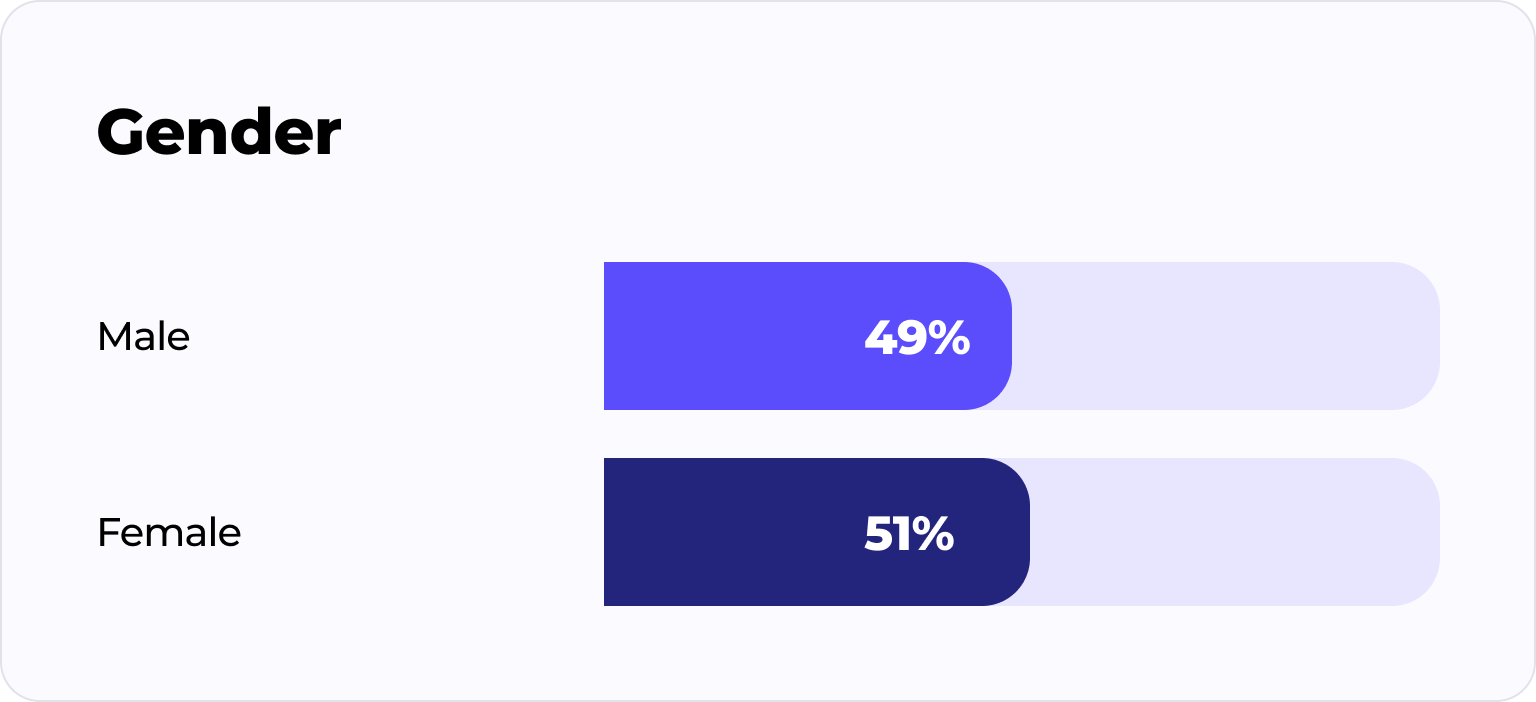
Learners surveyed
Credits
We extend our sincere thanks to the individuals and organizations whose expertise and perspectives shaped this year's report: Scott Cheney (Credential Engine); Bruce Etter, Julie Uranis, and Stacy Chiaramonte (UPCEA); Stephen Buckley (Digital Credentials Ltd); Wendy Palmer (Lifelong Learning Practice); Noah Geisel (University of Colorado Boulder); Frank Sorokach (Penn State); Curtiss Barnes (1EdTech Consortium); Holly Zanville (Learn & Work Ecosystem Library); Jennifer Fong (IEEE); Michelle Van Noy (Rutgers University); and Meghan Turjanica (McGraw Hill). Special appreciation goes to our research partner, Mantis Research, for their rigor and collaboration throughout this project.


